
Contents
- Intro
- Benchmark Dataset
- Benchmark Machine
- Benchmark Results
- Jena TDB
- Sesame (Native)
- Virtuoso - Triple Store
- D2R Server
- Virtuoso - RDF Views
- MySQL (SQL)
- Virtuoso (SQL)
- Store Comparison (Single Client)
- Store Comparison (Multiple Clients)
- Qualification
- Thanks
Document Version: 1.1
Publication
Date: 09/17/2008
1.
Introduction
The Berlin SPARQL Benchmark (BSBM)
is a benchmark for comparing the performance of storage systems that
expose SPARQL endpoints. Such systems include native RDF stores, Named
Graph stores,
systems that map relational databases into RDF, and SPARQL wrappers
around other kinds of data sources. The benchmark is built around an
e-commerce use case, where a set of products is offered by different
vendors and consumers have posted reviews about products.
This document presents the results of running the Berlin SPARQL Benchmark - Version 2 against
The stores were benchmarked with datasets ranging from 250,000 triples to 100,000,000 triples.
In oder to set the SPARQL results into context we also report the
results of running the SQL version of the benchmark against two
relational database management systems (MySQL 5.1.26 and Virtuoso - RDBMS Version 5.0.9).
Note that this document has been superseeded by the new results document for BSBM Version 3.
2.
Benchmark Dataset
We ran the benchmark using the Triple version and the relational version of the BSMB dataset (benchmark scenario NTR). The benchmark was run for different dataset sizes. The datasets were generated using the BSBM data generator and
fulfill the characteristics described in
section the
BSBM specification.
Details about the benchmark datasets are summarized in the following table:
Number of Triples
|
250K |
1M |
25M |
100M |
| Number of Products |
666 |
2,785 |
70,812 |
284,826 |
| Number of Producers |
14 |
60 |
1422 |
5,618 |
| Number of Product Features |
2,860 |
4,745 |
23,833 |
47,884 |
| Number of Product Types |
55 |
151 |
731 |
2011 |
| Number of Vendors |
8 |
34 |
722 |
2,854 |
| Number of Offers |
13,320 |
55,700 |
1,416,240 |
5,696,520 |
| Number of Reviewers |
339 |
1432 |
36,249 |
146,054 |
| Number of Reviews |
6,660 |
27,850 |
708,120 |
2,848,260 |
| Total Number of Instances |
23,922
|
92,757
|
2,258,129
|
9,034,027
|
| Exact Total Number of Triples |
250,030 |
1,000,313 |
25,000,244 |
100,000,112 |
| File Size Turtle (unzipped) |
22 MB |
86 MB |
2.1 GB |
8.5 GB |
There is a RDF triple and a relational representation of the benchmark datasets. Both representations can be downloaded below:
Download Turtle Representation of the Benchmark Datasets
- 250K Benchmark Dataset (Turtle, gzipped size: 5.5 MB)
- 1M Benchmark Dataset (Turtle, gzipped size: 22 MB)
- 25M Benchmark Dataset (Turtle, gzipped size: 545 MB)
- 100M Benchmark Dataset (Turtle, gzipped size: 2.2 GB)
Download MySQL dump of the Benchmark Datasets
- 250K Benchmark Dataset (SQL dump, gzipped size: 5.3 MB)
- 1M Benchmark Dataset (SQL dump, gzipped size: 22 MB)
- 25M Benchmark Dataset (SQL dump, gzipped size: 523 MB)
- 100M Benchmark Dataset (SQL dump, gzipped size: 2.1 GB)
Important: Test Driver data for all datasets:
(If you generate the datasets by yourself the Test Driver data is generated automatically in directory "td_data")
Download Test Driver data
3. Benchmark Machine
The benchmarks were run on a machine with the following specification:
- Hardware:
- Processors: Intel Core 2 Quad Q9450 2.66GHz, FSB 1333MHz,
L1 256KB, shared L2: overall 12,288KB
- Memory: 8GB DDR2 667 (4 x 2GB)
- Hard Disks: 160GB (10,000 rpm) SATA2, 750GB (7,200 rpm)
SATA2
- Software:
- Operating System: Ubuntu 8.04 64-bit, Kernel Linux
2.6.24-16-generic
- Java Runtime: VM 1.6.0
4. Benchmark Results
This section reports the results of running the BSBM benchmark
against three RDF stores, two relational database to RDF wrappers and
two relational database systems.
Test Procedure
The load performance of the systems was measured by loading the
Turtle representation of the BSBM datasets into the triple stores and
by loading the relational representation in the form of MySQL dumps
into the RDBMS behind D2R Server. The loaded datasets were forward
chained and contained all rdf:type statements for product types. Thus the systems under test did not have to do any inferencing.
The query performance of the systems was measured by running 128 BSBM query mixes
(altogether 3200 queries) against the systems over the SPARQL protocol.
The test driver and the system under test (SUT) were running on the
same machine in order to reduce the influence of network latency. In
order to enable the SUTs to load parts of the working set into main
memory and to take advantage of query result and query execution plan
caching, 32 BSBM query mixes (altogether 800 queries) were executed for
warm-up before the actual times were measured.
We applied the following test procedure to each store:
- Load data into the store
- Restart store
- Run first single-client test run (32 mixes warm-up, 128 mixes performance measurement, randomizer seed: 101011)
- Run second single-client test run (32 mixes warm-up, 128 mixes performance measurement, randomizer seed: 808080)
- Run the three multiple-clients test runs (each run includes 32
mixes warm-up, 128 mixes performance measurement, 4 clients: randomizer
seed: 863528, 8 clients: randomizer seed: 888326, 16 clients:
randomizer seed: 975932)
The different runs use distinct randomizer seeds for choosing query parameters.
This ensures that the test driver produces distinctly parameterized
queries over all runs and makes it harder for the stores to apply query
caching. Below, we report the better performance figures out of the two single-client runs.
For some test runs, we also recorded the performance of the cold, newly started SUTs. The following table gives an overview of the performance increase between the cold, newly started SUTs and the performance of the SUTs after warm up.
| SUT |
Dataset |
Overall time for the
first warm-up query mix |
Average overall time
for the measurement query mixes
|
Speed-up
factor |
| Sesame
Native |
25M |
59.337 sec |
4.860 sec |
12 |
| Virtuoso Triple Store |
25M |
56.242 sec |
1.545 sec |
36 |
| Virtuoso RDF Views |
100M |
8.484 sec |
1.942 sec |
4 |
| Virtuoso SQL mix |
100M |
11.171 sec |
1.278 sec |
8 |
| MySQL SQL mix |
100M |
42.202 sec |
0.667 sec |
63 |
4.1 TDB over
Joseki3
Jena TDB homepage
4.1.1 Configuration
The following changes were made to the default configuration of the software:
Log level for org.joseki set from INFO to WARN
4.1.2 Load Time
The table below summarizes the load times Turtle files (in hh:mm:ss) :
| 250K |
1M |
25M |
100M |
| 00:00:13 |
00:00:41 |
00:16:05 |
01:33:48 |
4.1.3 Benchmark Query
results: QpS (Queries per Second)
The table below summarizes the query throughput for each type of query over all 128 runs (in QpS):
4.1.4 Benchmark Overall results: QMpH for the 1M and 25M datasets for all runs
For the 1M and 25M datasets we ran tests with multiple clients (1,
4, 8 and 16 clients). The results are in Query Mixes per Hour (QMpH)
meaning that larger numbers are better.
|
|
1
|
4
|
8
|
16
|
|
1M
|
4,114
|
9,566
|
9,479
|
9,651
|
|
25M
|
160
|
230
|
357
|
255
|
4.1.5 Result Summaries
- TDB
1M:
| Number of clients |
1 |
4 |
8 |
16 |
| Download links |
|
|
|
|
- TDB 25M:
| Number of clients |
1 |
4 |
8 |
16 |
| Download links |
|
|
|
|
4.1.6 Run Logs (detailed information)
- TDB run log for 250K:
[txt]
- TDB run logs for 1M:
| Number of clients |
1 |
4 |
8 |
16 |
| Download links |
|
|
|
|
- TDB run logs for 25M:
| Number of clients |
1 |
4 |
8 |
16 |
| Download links |
|
|
|
|
4.2 Sesame (Native) over Tomcat
Sesame homepage
4.2.1 Configuration
Sesame was configured to use the "Native" storage schema. The
performance figures for other internal storage schemata will differ
from the reported figures.
The following changes were made to the default configuration of the software:
- Sesame: Version 2.2 - SVN Snapshot 2008-09-01
Store Type: Native
Indexes: spoc, posc, opsc
- Tomcat: Version 5.5.25.5ubuntu
JAVA_OPTS = ... -Xmx6144m ...
4.2.2 Load Time
The table below summarizes the load times of theTurtle files (in dd:hh:mm:ss) :
| 250K |
1M |
25M |
100M |
| 19 |
03:33 |
12:43:22 |
03:06:48:45 |
4.2.3 Benchmark Query
results: QpS (Queries per Second)
The table below summarizes the query throughput for each type of query over all 128 runs (in QpS):
4.2.4 Benchmark Overall results: QMpH for the 1M and 25M datasets for all runs
For the 1M and 25M datasets we ran tests with multiple clients (1,
4, 8 and 16 clients). The results are in Query Mixes per Hour (QMpH)
meaning that larger numbers are better.
|
|
1
|
4
|
8
|
16
|
|
1M
|
19,097
|
24,477
|
22,079
|
21,793
|
|
25M
|
899
|
1,108
|
1,190
|
1,192
|
4.2.5 Result Summaries
- Sesame 1M:
| Number of clients |
1 |
4 |
8 |
16 |
| Download links |
|
|
|
|
- Sesame 25M:
| Number of clients |
1 |
4 |
8 |
16 |
| Download links |
|
|
|
|
4.2.6
Run Logs (detailed information)
- Sesame run log for 250K:
[txt]
- Sesame run logs for 1M:
| Number of clients |
1 |
4 |
8 |
16 |
| Download links |
|
|
|
|
- Sesame run logs for 25M:
| Number of clients |
1 |
4 |
8 |
16 |
| Download links |
|
|
|
|
- Sesame run log for 100M:
[txt]
4.3 Virtuoso Open-Source Edition v5.0.9 Snapshot (Triple Store)
Virtuoso homepage
4.3.1 Configuration
The following changes were made to the default configuration of the software:
- Version: VOS 5.0.9 Snapshot 2008-09-15
- Configuration file changes:
MaxCheckpointRemap              = 1000000
NumberOfBuffers                 = 520000
MaxDirtyBuffers                 = 320000
MaxMemPoolSize                  = 0
StopCompilerWhenXOverRunTime    = 1
None
4.3.2 Load Time
The table below summarizes the load times of theTurtle files (in hh:mm:ss) :
| 250K |
1M |
25M |
100M |
| 00:00:05 |
00:00:25 |
00:40:27 |
08:15:16 |
4.3.3 Benchmark Query
results: QpS (Queries per Second)
The table below summarizes the query throughput for each type of query over all 128 runs (in QpS):
4.3.4 Benchmark Overall results: QMpH for the 1M and 25M datasets for all runs
For the 1M and 25M datasets we ran tests with multiple clients (1,
4, 8 and 16 clients). The results are in Query Mixes per Hour (QMpH)
meaning that larger numbers are better.
| |
1
|
4
|
8
|
16
|
|
1M
|
18,604
|
46,987
|
46,479
|
44,685
|
|
25M
|
2,563
|
5,595
|
6,004
|
4,759
|
4.3.5 Result Summaries
- Virtuoso (Triple Store) 250K:
[xml / txt]
- Virtuoso (Triple Store) 1M:
| Number of clients |
1 |
4 |
8 |
16 |
| Download links |
|
|
|
|
- Virtuoso (Triple Store) 25M:
| Number of clients |
1 |
4 |
8 |
16 |
| Download links |
|
|
|
|
- Virtuoso (Triple Store) 100M:
[xml / txt]
4.3.6
Run Logs (detailed information)
- Virtuoso (Triple store) run log for 250K:
[txt]
- Virtuoso (Triple store) run logs for 1M:
| Number of clients |
1 |
4 |
8 |
16 |
| Download links |
|
|
|
|
- Virtuoso (Triple store) run logs for 25M:
| Number of clients |
1 |
4 |
8 |
16 |
| Download links |
|
|
|
|
- Virtuoso (Triple store) run log 100M:
[txt]
4.4 D2R Server 0.4
D2R Server
is a relational database to RDF wrapper which rewrites SPARQL queries
into SQL queries against an application-specific relational schemata
based on a mapping. For the experiment, we used D2R Server together
with a MySQL database into which we loaded the relational
representation of the benchmark dataset.
4.4.1 Configuration
The following changes were made to the default configuration of the software:
Java: -Xmx6144m
- MySQL:
Version 5.1.26
- Configuration file changes:
key_buffer = 5600M
thread_cache = 64
sort_buffer_size = 16M
read_buffer_size = 8M
read_rnd_buffer_size = 16M
bulk_insert_buffer_size = 128M
thread_stack            = 1M
myisam_sort_buffer_size = 64M
thread_cache_size       = 64
Indexes:
- Indexes on every foreign key

- producttypeproduct(productType, product)

- review(product, person)
- offer(product, deliveryDays, validTo)
- productfeatureproduct(productFeature, product)
4.4.2 Load Time
The table below summarizes the load times of the SQL-dump (in hh:mm:ss) :
| 250K |
1M |
25M |
100M |
| 00:00:02 |
00:00:16 |
00:02:09 |
00:10:28 |
4.4.3 Benchmark Query
results: QpS (Queries per Second)
The table below summarizes the query throughput for each type of query over all 128 runs (in QpS):
Query 5 over the 25M and 100M dataset was excluded from the test run after hitting our 60 second query timeout.
4.4.4 Benchmark Overall results: QMpH for the 1M and 25M datasets for all runs
For the 1M and 25M datasets we ran tests with multiple clients (1,
4, 8 and 16 clients). The results are in Query Mixes per Hour (QMpH)
meaning that larger numbers are better.
|
|
1
|
4
|
8
|
16
|
|
1M
|
649
|
1,354
|
1,312
|
1,359
|
|
25M
|
3,262
|
4,706
|
4,702
|
4,719
|
Note: The 25M run was executed without query 5.
4.4.5 Result Summaries
- D2R Server 1M:
| Number of clients |
1 |
4 |
8 |
16 |
| Download links |
|
|
|
|
- D2R Server 25M:
| Number of clients |
1 |
4 |
8 |
16 |
| Download links |
|
|
|
|
4.4.6
Run Logs (detailed information)
- D2R Server run log for 250K:
[txt]
- D2R Server run logs for 1M:
| Number of clients |
1 |
4 |
8 |
16 |
| Download links |
|
|
|
|
- D2R Server run logs for 25M:
| Number of clients |
1 |
4 |
8 |
16 |
| Download links |
|
|
|
|
- D2R Server run log 100M:
[txt]
4.5 Virtuoso Open-Source Edition v5.0.9 Snapshot (RDF Views)
Virtuoso RDF Views
is a relational database to RDF wrapper which rewrites SPARQL queries
into SQL queries against an application-specific relational schemata
based on a mapping. Virtuoso RDF Views works together with the Virtuoso
RDBMS into which we loaded the relational representation of the
benchmark dataset.
Virtuoso homepage
4.5.1 Configuration
The following changes were made to the default configuration of the software:
- Version: VOS 5.0.9 Snapshot 2008-09-15
- Configuration file changes:
MaxCheckpointRemap              = 1000000
NumberOfBuffers                 = 520000
MaxDirtyBuffers                 = 320000
MaxMemPoolSize                  = 0
StopCompilerWhenXOverRunTime    = 1
No supplementary indexes.
- RDB tables and RDF views: File download
- Additional commands executed beforehand:
insert into SYS_SPARQL_HOST (SH_HOST, SH_DEFINES)

          values  ('%', 'define sql:describe-mode "SPO" ');
4.5.2 Load Time
The table below summarizes the load times of the SQL dump files (in hh:mm:ss) :
| 250K |
1M |
25M |
100M |
| 00:00:09 |
00:00:33 |
00:15:31 |
00:58:59 |
4.5.3Benchmark Query
results: QpS (Queries per Second)
The table below summarizes the query throughput for each type of query over all 128 runs (in QpS):
4.5.4 Benchmark Overall results: QMpH for the 1M and 25M datasets for all runs
For the 1M and 25M datasets we ran tests with multiple clients (1,
4, 8 and 16 clients). The results are in Query Mixes per Hour (QMpH)
meaning that larger numbers are better.
|
|
1
|
4
|
8
|
16
|
|
1M
|
24,826
|
56,431
|
56,339
|
57,425
|
|
25M
|
14,543
|
38,044
|
42,980
|
43,826
|
4.5.5 Result Summaries
- Virtuoso (RDF views) 250K:
[xml / txt]
- Virtuoso (RDF views) 1M:
| Number of clients |
1 |
4 |
8 |
16 |
| Download links |
|
|
|
|
- Virtuoso (RDF views) 25M:
| Number of clients |
1 |
4 |
8 |
16 |
| Download links |
|
|
|
|
- Virtuoso (RDF views) 100M:
[xml / txt]
4.5.6
Run Logs (detailed information)
- Virtuoso (RDF views) run log for 250K:
[txt]
- Virtuoso (RDF views) run logs for 1M:
| Number of clients |
1 |
4 |
8 |
16 |
| Download links |
|
|
|
|
- Virtuoso (RDF views) run logs for 25M:
| Number of clients |
1 |
4 |
8 |
16 |
| Download links |
|
|
|
|
- Virtuoso (RDF views) run log 100M:
[txt]
4.6 MySQL 5.1.26
In oder to set the performance figures of the RDF stores into context
and in order to be able to calculate the overhead that is produced by
rewriting SPARQL queries into SQL queries, we also ran the SQL version of the benchmark queries against the relational representation
of the benchmark dataset on MySQL. The semantics of some queries (9,
11, 12) can not be translated exactly into SQL. Although the
corresponding SQL queries give similar results, they are semantically
not as complex as the SPARQL queries. Thus the SQL results should just
be used for general orientation.
4.6.1 Configuration
The following changes were made to the default configuration of the software:
- MySQL:
Version 5.1.26
- Indexes:
- Indexes on every foreign key

- producttypeproduct(productType, product)

- review(product, person)
- offer(product, deliveryDays, validTo)
- productfeatureproduct(productFeature, product)
4.6.2 Load Time
The table below summarizes the load times of the SQL dump files (in hh:mm:ss) :
| 250K |
1M |
25M |
100M |
| 00:00:02 |
00:00:16 |
00:02:09 |
00:10:28 |
4.6.3 Benchmark Query
results: QpS (Queries per Second)
The table below summarizes the query throughput for each type of query over all 128 runs (in QpS):
|
250K |
1M |
25M |
100M |
| Query 1 |
2738.69 |
2378.56 |
1058.55 |
563.28 |
| Query 2 |
2768.51 |
3269.26 |
3125.51 |
3701.70 |
| Query 3 |
2638.38 |
2194.83 |
980.28 |
536.34 |
| Query 4 |
2425.36 |
2111.28 |
840.49 |
544.58 |
| Query 5 |
733.45 |
343.71 |
24.77 |
9.25 |
| Query 6 |
551.70 |
111.49 |
7.57 |
1.86 |
| Query 7 |
1460.24 |
774.39 |
714.51 |
724.81 |
| Query 8 |
2634.21 |
2712.51 |
582.99 |
414.54 |
| Query 9 |
2757.45 |
3392.31 |
2750.76 |
2855.80 |
| Query 10 |
3133.67 |
3378.01 |
2071.27 |
3353.90 |
| Query 11 |
5144.62 |
5867.07 |
2215.38 |
7262.50 |
| Query 12 |
4389.91 |
5120.33 |
4274.09 |
4998.41 |
4.6.4 Benchmark Overall results: QMpH for the 1M and 25M datasets for all runs
For the 1M and 25M datasets we ran tests with multiple clients (1,
4, 8 and 16 clients). The results are in Query Mixes per Hour (QMpH)
meaning that larger numbers are better.
|
|
1
|
4
|
8
|
16
|
|
1M
|
155,823
|
362,323
|
382,366
|
389,798
|
|
25M
|
18,986
|
38,208
|
38,654
|
39,006
|
4.6.5 Result Summaries
- MySQL 1M:
| Number of clients |
1 |
4 |
8 |
16 |
| Download links |
|
|
|
|
- MySQL 25M:
| Number of clients |
1 |
4 |
8 |
16 |
| Download links |
|
|
|
|
4.6.6
Run Logs (detailed information)
- MySQL run log for 250K:
[txt]
- MySQL run logs for 1M:
| Number of clients |
1 |
4 |
8 |
16 |
| Download links |
|
|
|
|
- MySQL run logs for 25M:
| Number of clients |
1 |
4 |
8 |
16 |
| Download links |
|
|
|
|
- MySQL run log 100M:
[txt]
4.7 Virtuoso Open-Source Edition v5.0.9 Snapshot (SQL)
In oder to set the performance figures of the RDF stores into context
and in order to be able to calculate the overhead that is produced by
rewriting SPARQL queries into SQL queries, we also ran the SQL version of the benchmark queries against the relational representation
of the benchmark dataset on Virtuoso's relational engine. The semantics
of some queries (9, 11, 12) can not be translated exactly into SQL.
Although the corresponding SQL queries give similar results, they are
semantically not as complex as the SPARQL queries. Thus the SQL results
should just be used for general orientation.
Please note: According to Orri Erling from OpenLink Software the 32 query mixes warm-up are not enough to properly fill the Virtuoso cache and bring the system into steady state. Thus, the performance figures that we reprot here are not
meaningful
for the SQL mixes. Orri has rerun the tests on a box at OpenLink using 2000 query mixes for warm-up which changed the results dramatically. See his blog post about this. We will also change our warm-up setup when we run the benchmark again in order to make sure that all systems are in steady state.
Virtuoso homepage
4.7.1 Configuration
The following changes were made to the default configuration of the software:
- Version: VOS 5.0.9 Snapshot 2008-09-15
- Configuration file changes:
MaxCheckpointRemap              = 1000000
NumberOfBuffers                 = 520000
MaxDirtyBuffers                 = 320000
MaxMemPoolSize                  = 0
StopCompilerWhenXOverRunTime    = 1
4.7.2 Load Time
The table below summarizes the load times of the SQL dump files (in hh:mm:ss) :
| 250K |
1M |
25M |
100M |
| 00:00:09 |
00:00:33 |
00:15:31 |
00:58:59 |
4.7.3 Benchmark Query
results: QpS (Queries per Second)
The table below summarizes the query throughput for each type of query over all 128 runs (in QpS):
|
250K |
1M |
25M |
100M |
| Query 1 |
1071.14 |
1004.35 |
764.07 |
157.89 |
| Query 2 |
1215.22 |
919.28 |
900.50 |
707.56 |
| Query 3 |
1029.19 |
900.23 |
778.75 |
154.46 |
| Query 4 |
962.56 |
913.64 |
719.98 |
142.73 |
| Query 5 |
345.11 |
185.63 |
14.52 |
7.72 |
| Query 6 |
2448.12 |
1341.07 |
95.81 |
25.05 |
| Query 7 |
623.25 |
687.16 |
72.66 |
8.40 |
| Query 8 |
1287.91 |
1241.05 |
76.28 |
8.85 |
| Query 9 |
1730.49 |
1874.73 |
323.55 |
48.19 |
| Query 10 |
1573.72 |
1519.07 |
1491.70 |
144.61 |
| Query 11 |
2193.30 |
2198.16 |
2438.44 |
2123.33 |
| Query 12 |
1978.78 |
1899.96 |
2194.64 |
2402.51 |
4.7.4 Benchmark Overall results: QMpH for the 1M and 25M datasets for all runs
For the 1M and 25M datasets we ran tests with multiple clients (1,
4, 8 and 16 clients). The results are in Query Mixes per Hour (QMpH)
meaning that larger numbers are better.
|
|
1
|
4
|
8
|
16
|
|
1M
|
129,849
|
216,349
|
261,576
|
293,339
|
|
25M
|
19,375
|
38,515
|
49,618
|
49,836
|
4.7.5 Result Summaries
- Virtuoso (SQL) 250K:
[xml / txt]
- Virtuoso (SQL) 1M:
| Number of clients |
1 |
4 |
8 |
16 |
| Download links |
|
|
|
|
- Virtuoso (SQL) 25M:
| Number of clients |
1 |
4 |
8 |
16 |
| Download links |
|
|
|
|
- Virtuoso (SQL) 100M:
[xml / txt]
4.7.6 Run Logs (detailed information)
- Virtuoso (SQL) run log for 250K:
[txt]
- Virtuoso (SQL) run logs for 1M:
| Number of clients |
1 |
4 |
8 |
16 |
| Download links |
|
|
|
|
- Virtuoso (SQL) run logs for 25M:
| Number of clients |
1 |
4 |
8 |
16 |
| Download links |
|
|
|
|
- Virtuoso (SQL) run log 100M:
[txt]
5. Store Comparison (Single Client)
This section compares the SPARQL query performance of the different stores and puts them into relation to the SQL query performance
of MySQL and Virtuoso's relational engine. The SQL performance figures
also allow to calculate the overhead that is produced by the relational
database to RDF wrappers when rewriting SPARQL queries into SQL queries
against the underlying RDBMS.
5.1 Overall Runtime
Running 128 query mixes
against the different stores took the following overall runtimes (in
seconds). The best performance figure for each dataset size is set bold
in the tables. This comparison excludes MySQL (SQL mix) and MySQL
(Virtuoso mix).
5.1.1 Overall Runtime: Complete Query Mix (in seconds)
The complete query mix is given here.
| |
Jena TDB |
Sesame
(Native)
|
Virtuoso
(Triple Store) |
D2R Server |
Virtuoso
(RDF Views) |
MySQL
(SQL mix) |
Virtuoso
(SQL mix)
|
| 250 K |
72.331 |
20.501 |
20.861 |
313.763 |
17.405 |
1.601 |
3.034 |
| 1 M |
112.014 |
24.129 |
24.768 |
709.537 |
18.561 |
2.957 |
3.549 |
| 25 M |
2886.843 |
512.320 |
179.775 |
not applicable* |
31.685 |
24.271 |
23.783 |
| 100 M |
9562.878 |
1831.567 |
775.890 |
not applicable* |
163.055 |
85.117 |
127.678 |
* as D2R Server timed out on query 5.
Please note concerning the SQL mix results: According to Orri Erling from OpenLink Software the 32 query mixes warm-up are not enough to properly fill the Virtuoso cache and bring the system into steady state. Thus, the performance figures that we reprot here are not meaningful for the SQL mixes. Orri has rerun the tests on a box at OpenLink using 2000 query mixes for warm-up which changed the results dramatically. See his blog post about this. We will also change our warm-up setup when we run the benchmark again in order to make sure that all systems are in steady state.
5.1.2 Overall Runtime: Reduced Query Mix (in seconds)
The reduced query mix consists of the same query sequence as the complete mix but without queries 5 and 6.
The two queries were excluded as they alone consumed a large portion of
the overall query execution time for bigger dataset sizes.
|
Jena TDB |
Sesame
(Native) |
Virtuoso
(Triple Store) |
D2R Server |
Virtuoso
(RDF Views) |
MySQL
(SQL mix) |
Virtuoso
(SQL mix)
|
| 250K |
34.365
|
15.262
|
19.376
|
64.159
|
16.578
|
1.286
|
2.671
|
| 1M |
36.956
|
10.212
|
21.523
|
62.082
|
17.204
|
1.618
|
2.850
|
| 25M |
297.949
|
194.200
|
112.376
|
61.135
|
22.134
|
2.554
|
13.788
|
| 100M |
937.893
|
606.073
|
511.071
|
253.522
|
|
2.956
|
106.052
|
5.1.3 Factor Table for the 25M Dataset (Complete Query Mix)
The table below compares the performance of the different stores on
a one-to-one basis. The table reads as follows: The Virtuoso triple
store was 2.84 times faster than Sesame (Native). Or: Running
the SQL query mix against MySQL was 7.4 times faster than running the
SPARQL query mix against the Virtuoso triple store.
| |
Jena TDB
|
Sesame
(Native)
|
Virtuoso
(Triple Store)
|
Virtuoso
(RDF Views)
|
MySQL (SQL)
|
Virtuoso
(SQL mix)
|
|
Jena TDB
|
1
|
0.1775
|
0.0623
|
0.0110
|
0.0084
|
0.0082
|
|
Sesame (Native)
|
5.6348
|
1
|
0.3509
|
0.0618
|
0.0474
|
0.0464
|
|
Virtuoso (Triple Store)
|
16.0581
|
2.8498
|
1
|
0.1762
|
0.1350
|
0.1323
|
|
Virtuoso (RDF Views)
|
91.1107
|
16.1692
|
5.6738
|
1
|
0.7660
|
0.7506
|
|
MySQL (SQL)
|
118.9421
|
21.1083
|
7.4070
|
1.3055
|
1
|
0.9799
|
| Virtuoso (SQL) |
121.3826
|
21.5414
|
7.5590
|
1.3323
|
1.0205
|
1
|
5.1.4 Factor table for the 25M dataset (Reduced Query Mix)
| |
TDB
|
Sesame
|
Virtuoso
(Triple Store)
|
D2R
|
Virtuoso
(RDF Views)
|
MySQL (SQL)
|
Virtuoso
(SQL mix)
|
|
Jena TDB
|
1
|
0.6518
|
0.3772
|
0.2052
|
0.0743
|
0.0086
|
0.0463
|
|
Sesame
|
1.5342
|
1
|
0.5787
|
0.3148
|
0.1140
|
0.0132
|
0.0710
|
|
Virtuoso (Triple Store)
|
2.6513
|
1.7281
|
1
|
0.5440
|
0.1970
|
0.0227
|
0.1227
|
|
D2R
|
4.8736
|
3.1766
|
1.8382
|
1
|
0.3620
|
0.0418
|
0.2255
|
|
Virtuoso (RDF Views)
|
13.4613
|
8.7740
|
5.0772
|
2.7621
|
1
|
0.1154
|
0.6230
|
|
MySQL (SQL)
|
116.6417
|
76.0260
|
43.9933
|
23.9332
|
8.6649
|
1
|
5.3979
|
| Virtuoso (SQL) |
21.6089
|
14.0845
|
8.1501
|
4.4338
|
1.6053
|
0.1853
|
1
|
5.2 Queries per Second by Query and Dataset Size
Running 128 query mixes
against the different stores lead to the following query throughput for
each type of query over all 128 runs (in Queries per Second). The best
performance figure for each dataset size is set bold in the tables. For
comparison reasons the MySQL and Virtuoso results for the SQL queries
are also included in the tables but not considered when determining
the best performance figure.
| |
250K |
1M |
25M |
100M |
| Jena TDB |
72.47 |
34.53 |
2.77 |
0.62 |
| Sesame (Native) |
541.80 |
532.69 |
67.13 |
13.65 |
| Virtuoso (Triple Store) |
309.54 |
307.94 |
201.91 |
86.54 |
| D2R Server |
309.60 |
273.32 |
231.17 |
85.24 |
| Virtuoso (RDF Views) |
273.99 |
266.41 |
215.90 |
72.23 |
| MySQL (SQL) |
2738.69 |
2378.56 |
1058.55 |
563.28 |
| Virtuoso (SQL) |
1071.14 |
1004.35 |
764.07 |
157.89 |
| |
250K |
1M |
25M |
100M |
| Jena TDB |
48.06 |
57.47 |
46.09 |
37.41 |
| Sesame (Native) |
198.96 |
195.12 |
90.85 |
35.52 |
| Virtuoso (Triple Store) |
85.57 |
76.53 |
59.45 |
45.21 |
| D2R Server |
24.35 |
25.58 |
26.87 |
29.96 |
| Virtuoso (RDF Views) |
116.04 |
111.45 |
101.86 |
54.34 |
| MySQL (SQL) |
2768.51 |
3269.26 |
3125.51 |
3701.70 |
| Virtuoso (SQL) |
1215.22 |
919.28 |
900.50 |
707.56 |
| |
250K |
1M |
25M |
100M |
| Jena TDB |
69.80 |
33.79 |
2.70 |
0.66 |
| Sesame (Native) |
414.53 |
427.05 |
57.37 |
12.57 |
| Virtuoso (Triple Store) |
250.55 |
243.45 |
195.12 |
83.80 |
| D2R Server |
168.17 |
116.06 |
42.38 |
18.28 |
| Virtuoso (RDF Views) |
261.91 |
256.80 |
231.26 |
62.60 |
| MySQL (SQL) |
2638.38 |
2194.83 |
980.28 |
536.34 |
| Virtuoso (SQL) |
1029.19 |
900.23 |
778.75 |
154.46 |
| |
250K |
1M |
25M |
100M |
| Jena TDB |
36.28 |
17.40 |
1.40 |
0.36 |
| Sesame (Native) |
425.53 |
269.64 |
49.03 |
10.21 |
| Virtuoso (Triple Store) |
178.02 |
176.30 |
72.31 |
38.60 |
| D2R Server |
192.42 |
179.15 |
142.08 |
68.48 |
| Virtuoso (RDF Views) |
166.44 |
165.54 |
139.21 |
49.99 |
| MySQL (SQL) |
2425.36 |
2111.28 |
840.49 |
544.58 |
| Virtuoso (SQL) |
962.56 |
913.64 |
719.98 |
142.73 |
| |
250K |
1M |
25M |
100M |
| Jena TDB |
3.38 |
1.72 |
0.06 |
0.02 |
| Sesame (Native) |
43.25 |
26.83 |
1.54 |
0.52 |
| Virtuoso (Triple Store) |
153.27 |
111.19 |
13.07 |
5.64 |
| D2R Server |
0.52 |
0.20 |
timeout |
timeout |
| Virtuoso (RDF Views) |
225.69 |
132.91 |
28.54 |
8.40 |
| MySQL (SQL) |
733.45 |
343.71 |
24.77 |
9.25 |
| Virtuoso (SQL) |
345.11 |
185.63 |
14.52 |
7.72 |
| |
250K |
1M |
25M |
100M |
| Jena TDB |
153.25 |
85.15 |
0.32 |
0.08 |
| Sesame (Native) |
49.37 |
12.99 |
0.54 |
0.13 |
| Virtuoso (Triple Store) |
174.24 |
56.91 |
2.20 |
0.53 |
| D2R Server |
35.81 |
16.46 |
1.58 |
0.33 |
| Virtuoso (RDF Views) |
401.24 |
264.18 |
23.53 |
6.04 |
| MySQL (SQL) |
551.70 |
111.49 |
7.57 |
1.86 |
| Virtuoso (SQL) |
2448.12 |
1341.07 |
95.81 |
25.05 |
| |
250K |
1M |
25M |
100M |
| Jena TDB |
84.67 |
151.82 |
10.26 |
5.74 |
| Sesame (Native) |
66.76 |
237.83 |
4.84 |
1.63 |
| Virtuoso (Triple Store) |
122.85 |
115.41 |
18.01 |
2.08 |
| D2R Server |
44.77 |
63.22 |
55.80 |
3.90 |
| Virtuoso (RDF Views) |
134.16 |
127.10 |
79.18 |
8.05 |
| MySQL (SQL) |
1460.24 |
774.39 |
714.51 |
724.81 |
| Virtuoso (SQL) |
623.25 |
687.16 |
72.66 |
8.40 |
| |
250K |
1M |
25M |
100M |
| Jena TDB |
143.33 |
139.98 |
11.28 |
9.50 |
| Sesame (Native) |
308.24 |
330.65 |
12.82 |
3.76 |
| Virtuoso (Triple Store) |
185.77 |
173.88 |
42.03 |
4.68 |
| D2R Server |
31.33 |
26.26 |
29.96 |
11.12 |
| Virtuoso (RDF Views) |
199.95 |
190.17 |
124.44 |
8.80 |
| MySQL (SQL) |
2634.21 |
2712.51 |
582.99 |
414.54 |
| Virtuoso (SQL) |
1287.91 |
1241.05 |
76.28 |
8.85 |
| |
250K |
1M |
25M |
100M |
| Jena TDB |
421.66 |
420.42 |
99.40 |
49.23 |
| Sesame (Native) |
755.91 |
854.57 |
52.87 |
15.63 |
| Virtuoso (Triple Store) |
509.84 |
495.50 |
159.52 |
18.83 |
| D2R Server |
73.74 |
67.18 |
77.58 |
62.16 |
| Virtuoso (RDF Views) |
617.14 |
610.13 |
512.14 |
78.53 |
| MySQL (SQL) |
2757.45 |
3392.31 |
2750.76 |
2855.80 |
| Virtuoso (SQL) |
1730.49 |
1874.73 |
323.55 |
48.19 |
| |
250K |
1M |
25M |
100M |
| Jena TDB |
355.41 |
358.71 |
18.63 |
8.60 |
| Sesame (Native) |
382.46 |
379.98 |
6.78 |
2.14 |
| Virtuoso (Triple Store) |
212.85 |
142.24 |
5.12 |
1.72 |
| D2R Server |
133.91 |
148.45 |
148.89 |
4.95 |
| Virtuoso (RDF Views) |
301.81 |
294.78 |
238.37 |
116.84 |
| MySQL (SQL) |
3133.67 |
3378.01 |
2071.27 |
3353.90 |
| Virtuoso (SQL) |
1573.72 |
1519.07 |
1491.70 |
144.61 |
Query 11
| |
250K |
1M |
25M |
100M |
| Jena TDB |
417.44 |
474.70 |
84.68 |
30.56 |
| Sesame (Native) |
713.72 |
797.33 |
49.75 |
13.23 |
| Virtuoso (Triple Store) |
415.76 |
414.33 |
31.24 |
27.62 |
| D2R Server |
231.12 |
239.10 |
205.61 |
114.21 |
| Virtuoso (RDF Views) |
156.04 |
156.92 |
135.54 |
41.54 |
| MySQL (SQL) |
5144.62 |
5867.07 |
2215.38 |
7262.50 |
| Virtuoso (SQL) |
2193.30 |
2198.16 |
2438.44 |
2123.33 |
Query 12
| |
250K |
1M |
25M |
100M |
| Jena TDB |
284.36 |
290.30 |
71.64 |
41.11 |
| Sesame (Native) |
588.37 |
672.37 |
54.20 |
17.86 |
| Virtuoso (Triple Store) |
209.12 |
208.00 |
31.70 |
23.68 |
| D2R Server |
202.75 |
192.52 |
205.02 |
91.26 |
| Virtuoso (RDF Views) |
220.55 |
223.50 |
208.99 |
78.16 |
| MySQL (SQL) |
4389.91 |
5120.33 |
4274.09 |
4998.41 |
| Virtuoso (SQL) |
1978.78 |
1899.96 |
2194.64 |
2402.51 |
5.3 Queries per Second by Dataset Size and Query
Running 128 query mixes
against the different stores lead to the following query throughput for
each type of query over all 128 runs (in Queries per Second). The best
performance figure for each query is set bold in the tables. For
comparison reasons the MySQL and Virtuoso results for the SQL queries
are also included in the tables but not considered when determining
the best performance figure.
250K Triple Dataset
| |
TDB |
Sesame |
Virtuoso |
D2R |
Virtuoso (RDF Views) |
MySQL (SQL) |
Virtuoso (SQL) |
| Query 1 |
72.47 |
541.80 |
309.54 |
309.60 |
273.99 |
2738.69 |
1071.14 |
| Query 2 |
48.06 |
198.96 |
85.57 |
24.35 |
116.04 |
2768.51 |
1215.22 |
| Query 3 |
69.80 |
414.53 |
250.55 |
168.17 |
261.91 |
2638.38 |
1029.19 |
| Query 4 |
36.28 |
425.53 |
178.02 |
192.42 |
166.44 |
2425.36 |
962.56 |
| Query 5 |
3.38 |
43.25 |
153.27 |
0.52 |
225.69 |
733.45 |
345.11 |
| Query 6 |
153.25 |
49.37 |
174.24 |
35.81 |
401.24 |
551.70 |
2448.12 |
| Query 7 |
84.67 |
66.76 |
122.85 |
44.77 |
134.16 |
1460.24 |
623.25 |
| Query 8 |
143.33 |
308.24 |
185.77 |
31.33 |
199.95 |
2634.21 |
1287.91 |
| Query 9 |
421.66 |
755.91 |
509.84 |
73.74 |
617.14 |
2757.45 |
1730.49 |
| Query 10 |
355.41 |
382.46 |
212.85 |
133.91 |
301.81 |
3133.67 |
1573.72 |
| Query 11 |
417.44 |
713.72 |
415.76 |
231.12 |
156.04 |
5144.62 |
2193.30 |
| Query 12 |
284.36 |
588.37 |
209.12 |
202.75 |
220.55 |
4389.91 |
1978.78 |
1M Triple Dataset
| |
TDB |
Sesame |
Virtuoso |
D2R |
Virtuoso (RDF Views) |
MySQL (SQL) |
Virtuoso (SQL) |
| Query 1 |
34.53 |
532.69 |
307.94 |
273.32 |
266.41 |
2378.56 |
1004.35 |
| Query 2 |
57.47 |
195.12 |
76.53 |
25.58 |
111.45 |
3269.26 |
919.28 |
| Query 3 |
33.79 |
427.05 |
243.45 |
116.06 |
256.80 |
2194.83 |
900.23 |
| Query 4 |
17.40 |
269.64 |
176.30 |
179.15 |
165.54 |
2111.28 |
913.64 |
| Query 5 |
1.72 |
26.83 |
111.19 |
0.20 |
132.91 |
343.71 |
185.63 |
| Query 6 |
85.15 |
12.99 |
56.91 |
16.46 |
264.18 |
111.49 |
1341.07 |
| Query 7 |
151.82 |
237.83 |
115.41 |
63.22 |
127.10 |
774.39 |
687.16 |
| Query 8 |
139.98 |
330.65 |
173.88 |
26.26 |
190.17 |
2712.51 |
1241.05 |
| Query 9 |
420.42 |
854.57 |
495.50 |
67.18 |
610.13 |
3392.31 |
1874.73 |
| Query 10 |
358.71 |
379.98 |
142.24 |
148.45 |
294.78 |
3378.01 |
1519.07 |
| Query 11 |
474.70 |
797.33 |
414.33 |
239.10 |
156.92 |
5867.07 |
2198.16 |
| Query 12 |
290.30 |
672.37 |
208.00 |
192.52 |
223.50 |
5120.33 |
1899.96 |
25M Triple Dataset
| |
TDB |
Sesame |
Virtuoso |
D2R |
Virtuoso (RDF Views) |
MySQL (SQL) |
Virtuoso (SQL) |
| Query 1 |
2.77 |
67.13 |
201.91 |
231.17 |
215.90 |
1058.55 |
764.07 |
| Query 2 |
46.09 |
90.85 |
59.45 |
26.87 |
101.86 |
3125.51 |
900.50 |
| Query 3 |
2.70 |
57.37 |
195.12 |
42.38 |
231.26 |
980.28 |
778.75 |
| Query 4 |
1.40 |
49.03 |
72.31 |
142.08 |
139.21 |
840.49 |
719.98 |
| Query 5 |
0.06 |
1.54 |
13.07 |
timeout |
28.54 |
24.77 |
14.52 |
| Query 6 |
0.32 |
0.54 |
2.20 |
1.58 |
23.53 |
7.57 |
95.81 |
| Query 7 |
10.26 |
4.84 |
18.01 |
55.80 |
79.18 |
714.51 |
72.66 |
| Query 8 |
11.28 |
12.82 |
42.03 |
29.96 |
124.44 |
582.99 |
76.28 |
| Query 9 |
99.40 |
52.87 |
159.52 |
77.58 |
512.14 |
2750.76 |
323.55 |
| Query 10 |
18.63 |
6.78 |
5.12 |
148.89 |
238.37 |
2071.27 |
1491.70 |
| Query 11 |
84.68 |
49.75 |
31.24 |
205.61 |
135.54 |
2215.38 |
2438.44 |
| Query 12 |
71.64 |
54.20 |
31.70 |
205.02 |
208.99 |
4274.09 |
2194.64 |
100M Triple Dataset
| |
TDB |
Sesame |
Virtuoso |
D2R |
Virtuoso (RDF Views) |
MySQL (SQL) |
Virtuoso (SQL) |
| Query 1 |
0.62 |
13.65 |
86.54 |
85.24 |
72.23 |
563.28 |
157.89 |
| Query 2 |
37.41 |
35.52 |
45.21 |
29.96 |
54.34 |
3701.70 |
707.56 |
| Query 3 |
0.66 |
12.57 |
83.80 |
18.28 |
62.60 |
536.34 |
154.46 |
| Query 4 |
0.36 |
10.21 |
38.60 |
68.48 |
49.99 |
544.58 |
142.73 |
| Query 5 |
0.02 |
0.52 |
5.64 |
timeout |
8.40 |
9.25 |
7.72 |
| Query 6 |
0.08 |
0.13 |
0.53 |
0.33 |
6.04 |
1.86 |
25.05 |
| Query 7 |
5.74 |
1.63 |
2.08 |
3.90 |
8.05 |
724.81 |
8.40 |
| Query 8 |
9.50 |
3.76 |
4.68 |
11.12 |
8.80 |
414.54 |
8.85 |
| Query 9 |
49.23 |
15.63 |
18.83 |
62.16 |
78.53 |
2855.80 |
48.19 |
| Query 10 |
8.60 |
2.14 |
1.72 |
4.95 |
116.84 |
3353.90 |
144.61 |
| Query 11 |
30.56 |
13.23 |
27.62 |
114.21 |
41.54 |
7262.50 |
2123.33 |
| Query 12 |
41.11 |
17.86 |
23.68 |
91.26 |
78.16 |
4998.41 |
2402.51 |
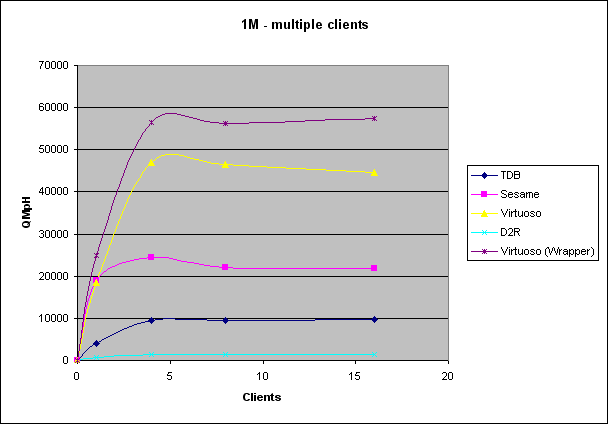
6. Store Comparison (Multiple Clients)
In real-world situations there are usually multiple clients working
against a SPARQL endpoint. Thus we have also benchmarked how the SUTs
reacted to multiple clients simultaneously
executing query mixes against the SUTs.
The numbers are the query mixes per hour (QMpH) that were executed
by all clients together. Meaning that bigger numbers are better.
For comparison reasons, the MySQL results for the SQL queries are also
included in the tables. Note that the query mixes per hour values were
extrapolated from the time it took all clients together to execute 128
query mixes (see test procedure).
| Dataset Size 1M |
|
Number of clients |
|
| |
1
|
4
|
8
|
16
|
| Jena TDB |
4,114
|
9,566
|
9,479
|
9,651
|
| Sesame (Native) |
19,097
|
24,477
|
22,079
|
21,793
|
| Virtuoso (Triple Store) |
18,604
|
46,987
|
46,479
|
44,685
|
| D2R Server |
649
|
1,354
|
1,312
|
1,359
|
| Virtuoso (RDF Views) |
24,826
|
56,431
|
56,339
|
57,425
|
| MySQL (SQL) |
155,823
|
362,323
|
382,366
|
389,798
|
| Virtuoso (SQL) |
129,849
|
216,349
|
261,576
|
293,339
|
| Dataset Size 25M |
|
Number of clients |
|
| |
1
|
4
|
8
|
16
|
| TDB |
160
|
230
|
357
|
255
|
| Sesame |
899
|
1,108
|
1,190
|
1,192
|
| Virtuoso (Triple Store) |
2,563
|
5,595
|
6,004
|
4,759
|
| D2R |
3,262 *
|
4,706 *
|
4,702 *
|
4,719 *
|
| Virtuoso (RDF Views) |
14,543
|
38,044
|
42,980
|
43,826
|
| MySQL (SQL) |
18,986
|
38,208
|
38,654
|
39,006
|
| Virtuoso (SQL) |
19,375
|
38,515
|
49,618
|
49,836
|
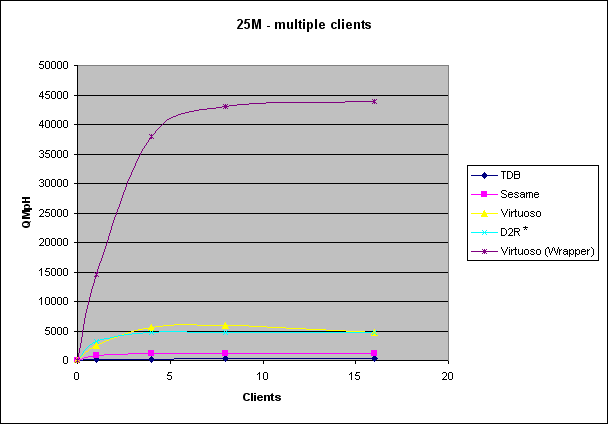
* without query 5
7. Qualification
A precondition for comparing the performance of different storage systems, is to verify that all systems work correctly and return the exprected query results.
Thus before we measured the performance of the SUTs, we verified that the SUTs return correct results for the benchmark queries using the BSBM qualification dataset and qualtification tool. For more information about the qualification test please refer to the qualification chapter of the BSBM specification.
7.1 Results
We ran qualification tests for following stores: Sesame, TDB, Virtuoso Triple Store and D2R.
- Sesame and TDB were both flawless.
- Virtuoso Triple Store and D2R had problems with the
xsd:dateTime data types. D2R does not seem to support
xsd:dateTime, so Queries 8, 10, 11 and 12 could not be executed thus
had to be ignored. All other queries returned the correct results.
Virtuoso on the other hand accepted all queries and also returned
correct results for all queries. The only flaw was that the returned
xsd:dateTime format is not a valid xsd:dateTime format.
7.1 Detailed logs
D2R:
TDB:
Sesame:
Virtuoso:
8. Thanks
Lots of thanks to
- Eli Lilly and Company and especially Susie Stephens for making this work possible with a research grant.
- Orri Erling, Andy Seaborne, Arjohn Kampman, Michael Schmidt,
Richard Cyganiak, Ivan Mikhailov, Patrick van Kleef, and Christian
Becker for their feedback on the benchmark design and their help with
configuring the stores and running the benchmark experiment.
Please send comments and feedback about the benchmark to Chris Bizer and Andreas Schultz and to the relevant mailing lists.